How They Compare Locally and Statewide
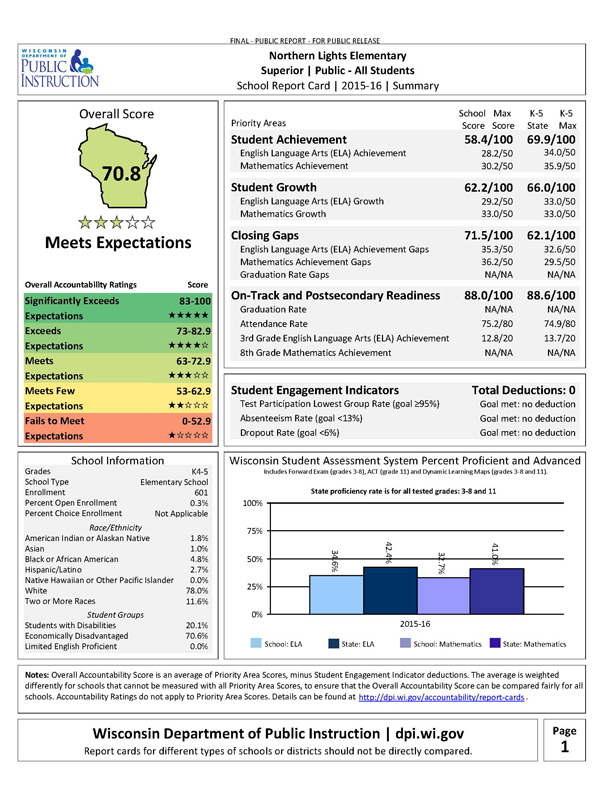
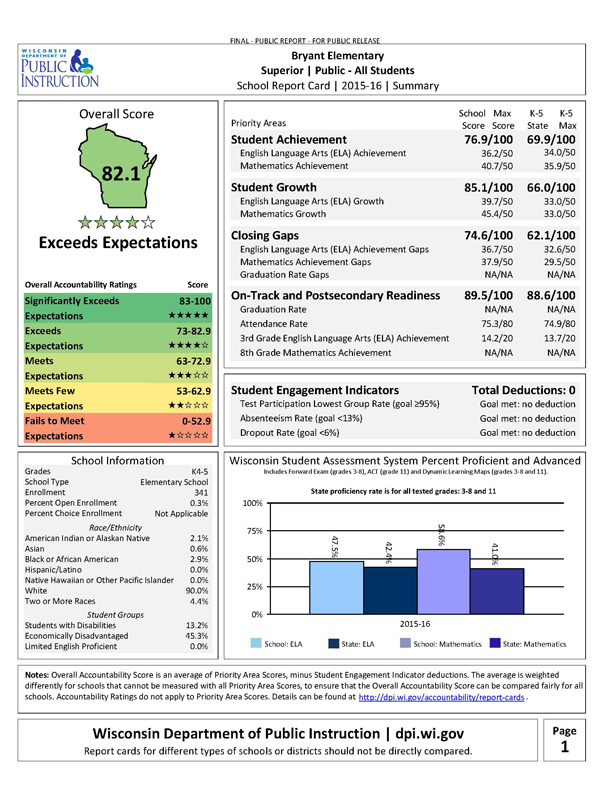
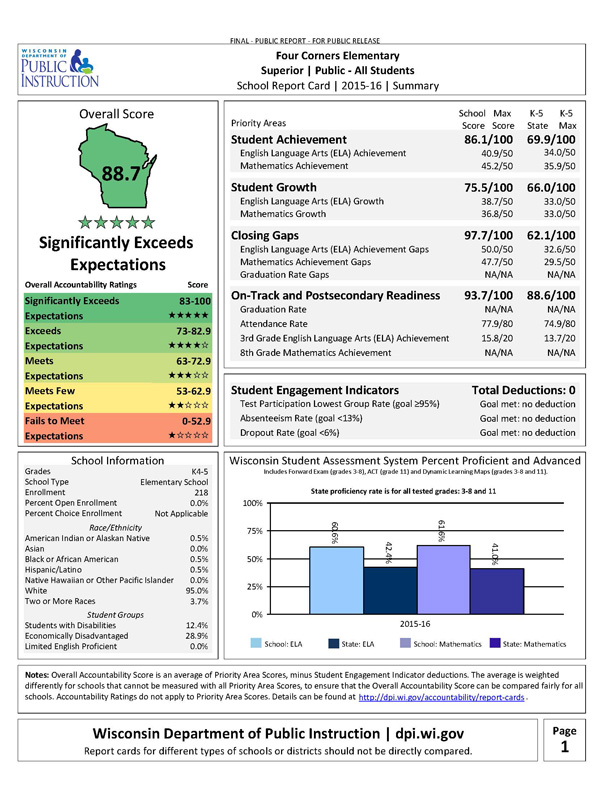
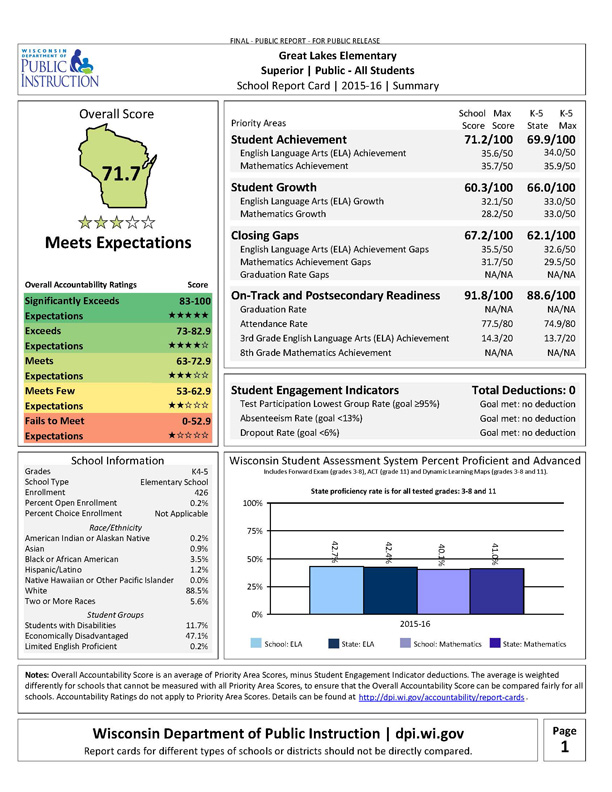
 Each year the Wisconsin Office of Educational Accountability issues a “report card” for every school in the state. Here is a summary table displaying how all of the six elementary K-5 schools in the School District of Superior compare to state averages.
Scores for each school in each priority area are color coded to coincide with the colors of the OEA School Report Cards table. Scores that are below the state average are shown using red text.
 All data taken from the Wisconsin Department of Public Instruction website, and from the Accountability Reports Cards page on this website.
Judging from the coloration of this table, it would appear that some of our schools have a bit of work to do to achieve state average scores in some categories, at least compared to what the state department of education mandates.
Each school is also given an overall score, and this is encouraging since every Superior K-5 school received a Meets Expectations score or above. Here are the overall scores of all elementary schools.
| School Name | Overall Score | Rating |
| Four Corners | 88.7% | Significantly Exceeds Expectations |
| Bryant | 82.1% | Exceeds Expectations |
| Cooper | 77.5% | Exceeds Expectations |
| Great Lakes | 71.7% | Meets Expectations |
| Northern Lights | 70.8% | Meets Expectations |
| Lake Superior | 68.3% | Meets Expectations |
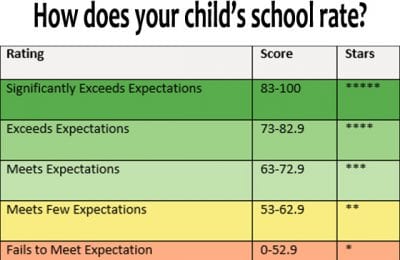
For more details on how each category is defined, please see image displayed below this table. Below that we’ve added a slider that shows how each school ranked in greater detail.

The above standards are how the WI Office of Educational Accountability reports on the effectiveness of Wisconsin Schools.
There are six images in this slider, one for each K-5 school in the Superior School District. They rotate every 10 seconds. Click on any image to immediately go to the next one.